Welcome to the Qpercom Assessment Platform! When the live assessment concludes, the critical work of finalising robust and justifiable outcomes begins.
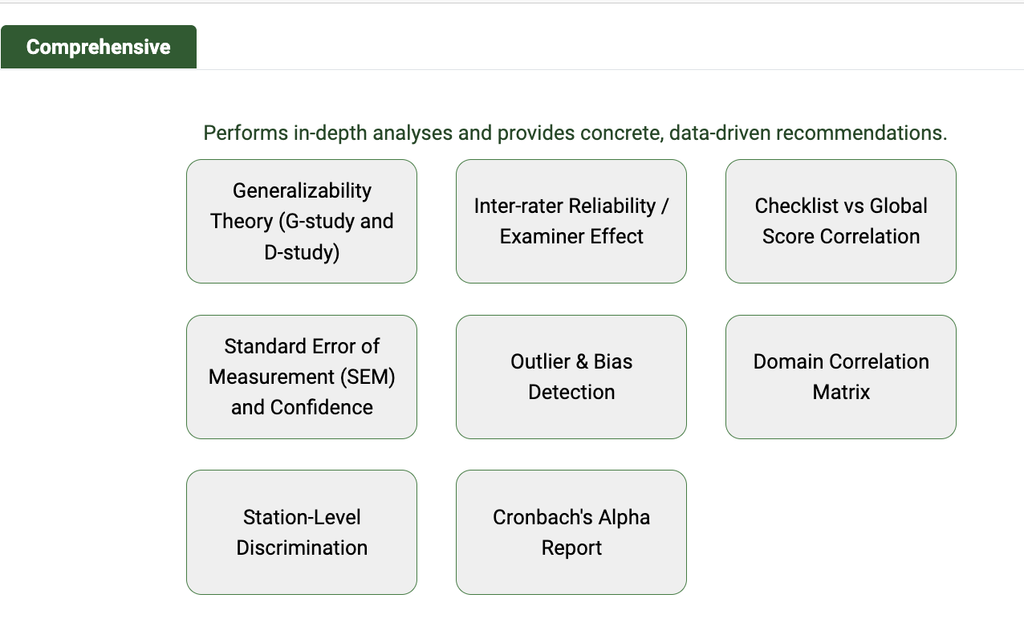
Qpercom’s post-assessment advanced analysis tools are designed to streamline standard setting. The platform allows you to run fully-fledged Borderline Regression Analysis, compare pre- and post-standard setting cut-scores, and publish finalised results with just a few clicks.
This comprehensive guide will walk you through everything you need to know to run advanced analysis, from completing your initial Quality Assurance checklist to exporting your final adjusted results.
1. Getting Started: The Quality Assurance (QA) Checklist
Before you can run any advanced analysis, you must ensure your dataset is clean and complete.
- Access the QA Tab: Click on the results histogram for the assessment event you want to analyse, then navigate to the QA / Export tab.
- Complete the Checklist: You must confirm several requirements, including that you have a full dataset and that a consistent Global Rating Scale (GRS) has been used across all stations.
- Confirm & Publish: Once verified, click Confirm & Publish.
- Export Raw Data: After publishing the QA checklist, you will be presented with options to export your raw data to a file if you wish to retain an unadjusted copy.
2. Configuring Your Advanced Analysis Method
Once your QA is published, click the Advanced Analysis button to open the configuration pop-up.
- Name Your Analysis: Input a clear analysis name for your records.
- Choose Your Method: You can select from four Borderline Regression methods: Borderline Group Average, Borderline Regression Method 1, Borderline Regression Method 2, or the Contrasting Method.
- Match Your GRS: Crucial Step: You must ensure the method you choose matches the Global Rating Scale used in your scoresheets.
- Use Borderline Regression Method 1 if your GRS uses Fail, Borderline, Pass.
- Use Borderline Regression Method 2 if your GRS uses Fail, Borderline Fail, Borderline Pass, Pass.
3. Adjusting SEM, Cronbach’s Alpha & Exam Rules
Within the same configuration pop-up, you can refine your statistical parameters before calculating.
- SEM Options: You can choose to include Standard Error of Measurement adjustments. Options include SEM 1 (68% Confidence Interval) or SEM 2 (95% Confidence Interval). The lower bound of your chosen SEM will be used as an adjustment.
- Cronbach’s Alpha: Check this box to include reliability coefficients for your stations.
- Current Exam Rules: Advanced Analysis pulls from your current exam settings, but you can adjust them here. You can switch calculations between Percentages or Actual Scores, adjust decimal precision (up to 3 places), set the minimum number of stations to pass, and decide whether multi-examiner scores should be aggregated or averaged.
- Calculate: When you have specified all criteria, scroll down and click Calculate.
4. Viewing Your Results & Graphs
Once calculated, the system will return your adjusted cut-scores across three detailed tabs:
- Results Tab: This interactive table displays a row for every candidate. Green represents a pass and red represents a fail based on your newly adjusted cut-scores. You can use the “Pivot Mode” on the right to toggle specific data columns on or off.
- Station Summary Tab: This tab provides a performance summary for each individual station, highlighting the newly calculated Cut Score %.
- Graphs Tab: Here you can view visual scatter plots for each station. Expand any graph to see the regression line, the applied regression formula, the R2 value, and the SEM shading.
5. Publishing & Exporting Your Adjusted Data
Once you are satisfied with the Advanced Analysis, you have several options for finalising the data.
- Update Rules: If you need to tweak your settings, click Update Rules to recalculate with different parameters.
- Exporting: You can export your comprehensive results to a CSV or Excel file, and export your scatter plot graphs directly to a PDF.
- Save Adjusted to Exam: To finalise the assessment, select this option to publish the adjusted station cut-scores directly back to Qpercom. You can choose whether to include or exclude the SEM adjustment before clicking Publish.
- Verify in Qpercom: Once published, return to your assessment. On the Rules tab, “Adjustment by Advanced Analysis” will now display as Yes, and the cut-scores will reflect your updates. On the Raw Data tab, an adjusted Source/Trigger column will appear, detailing the advanced analysis rules applied to the final weighted or aggregated scores.
Thank you for your vital role in finalising assessment outcomes!