What are Global Rating Scores?
In clinical skills or observational assessment, apart from item score sheets, Global Rating Scores (GRS) are used. A GRS reflects the professional opinion of the examiner once they have completed the item score list. This list represents what they have observed or marked during the scenario. In most cases, a 5 or 6 item Likert scale is used ranging from 0 = Fail; 1 = Borderline; 2 = Pass; 3 = Good to 4 = Excellent. Sometimes, if examiners can’t choose between Borderline and Fail or Borderline and Pass an extra option is brought into this GRS. Now examiners have the option to choose between 0 = Fail; 1 = Borderline fail; 2 = Borderline pass; 3 = Pass and 4 and 5 are Good and Excellent, respectively.
The GRS is a nominal scale, that is, a qualitative judgement of the examiner. The numerical values on the scale represent the professional judgement of the examiner, of the quality of what was observed. The numerical values used on the scale are NOT used as part of the marking, they are regarded as a separate qualitative entity. However, if these judgments are considered one could match the marks with these Global Ratings.
In general, one may expect those students globally rated as Fail would get a mark on their item score sheet that corresponds to a Fail mark (between 0 – cut-off score 50, 55 or 60). A Borderline score is supposed to correspond with a score around the cut-score, somewhere between 45 and 55% (assuming the cut-off score is 50%). A Pass would be a score above 55 and anything higher than 65 – 70 is rated as Good or Excellent.
Three Methods for Regression Analysis
The GRS can be used for retrospective standard setting in contrast to prospective standard setting, such as, Angoff or Cohen. Retrospectively, it would be interesting to see what the average mark would be of those students who received a Borderline judgement. If the score sheet scores of those students with a Borderline on their GRS are added up, and the total score is divided by the number of Borderline students, the answer represents the Borderline Group Average (BGA). This average can be used as the cut-off score (the simplest form of retrospective standard setting) to be compared to the arbitrary cut-off score (agreed cut-score) or the Angoff standard setting cut-score.
However, the BGA can be unreliable in cases where only a few students were marked as Borderline. In these instances, the average will be very unstable or unreliable as a result of those low numbers. The more students in the exam class and the more Borderliners observed, the more stable the BGA will be. Nevertheless, in most cases the Borderline Regression Method 1 or 2 are preferred, depending on the type of GRS used. Method 1 or 2 refer to either 1 Borderline option or 2 Borderline options e.g. Borderline fail and Borderline pass.
A linear regression method is used between 1, the item score sheet total and 2, the GRS. The item score sheet total will be represented on the Y-axis and the GRS will be represented on the X-axis of a plotted diagram. All dots will appear in a vertical line matching the 5 or 6 item GRS on the X-axis. Various statistical software packages, including Excel, facilitate the selection of a linear regression method. This will produce a regression formula and will be represented in a regression line.
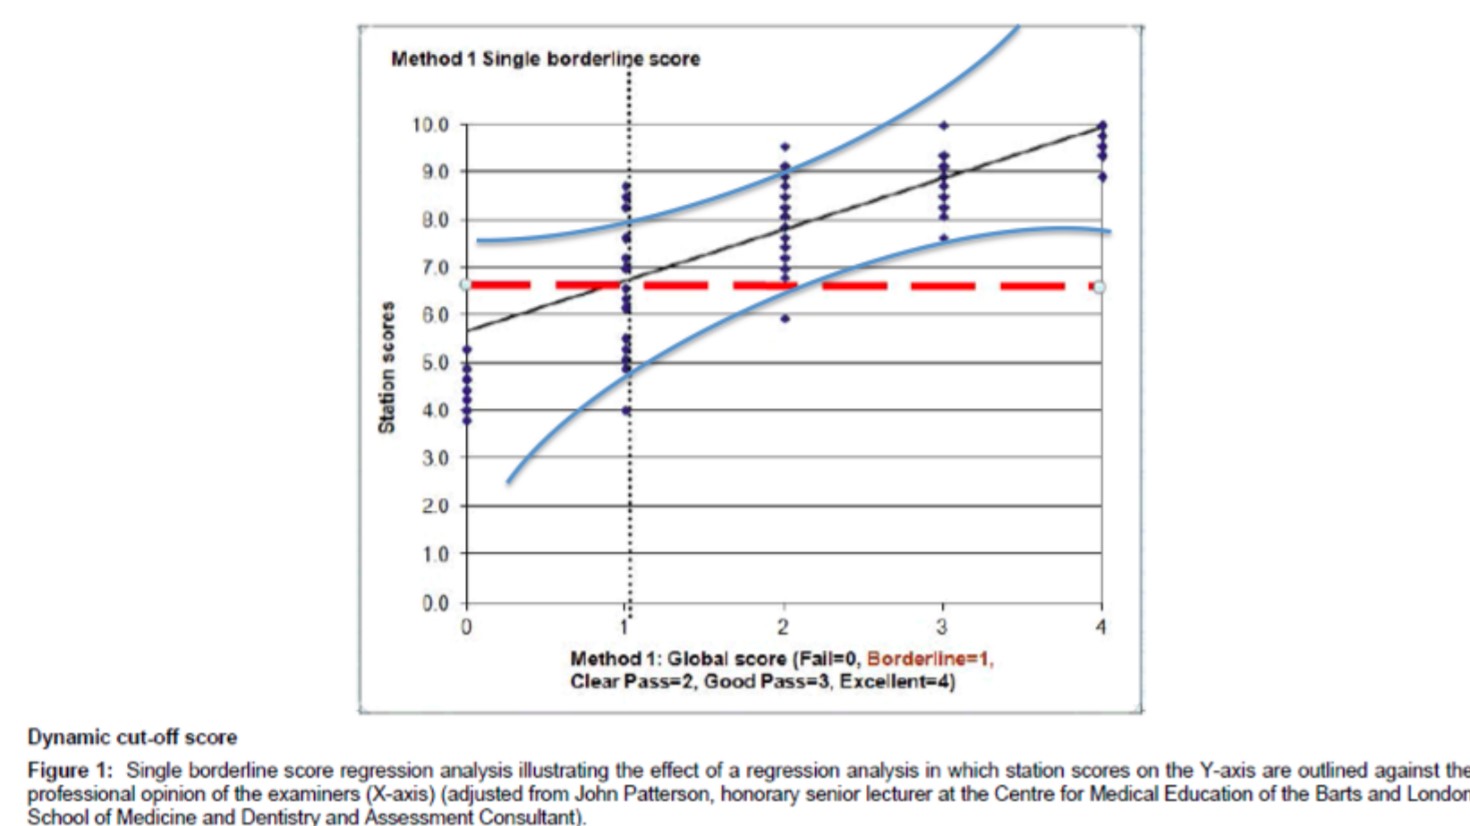
Drawing a vertical line through 1, Borderline, and a horizontal line through the point where the Borderline scores cross the regression line, the Borderline regression cut-off score can be seen on the vertical axis. Otherwise, while adding X=1 in the regression formula, the outcome will exactly correspond with the outcome on the Y-axis, which is the new cut-off score.
The advantage of this method over the previous BGA method is not only the Borderliners are considered, in addition, all scores are accounted for. The difference between method 1 and 2 is the new cut-off score is right between 1 and 2 on the X-axis, representing Borderline fail (1) and Borderline pass (2). In comparison, this cut score is always higher than BRM 1. Assessment literature provides even more advanced methods of Linear Regression Analysis, which are outside of the scope of this article.